US Treasuries market yield
https://fred.stlouisfed.org/graph/?g=KFaj
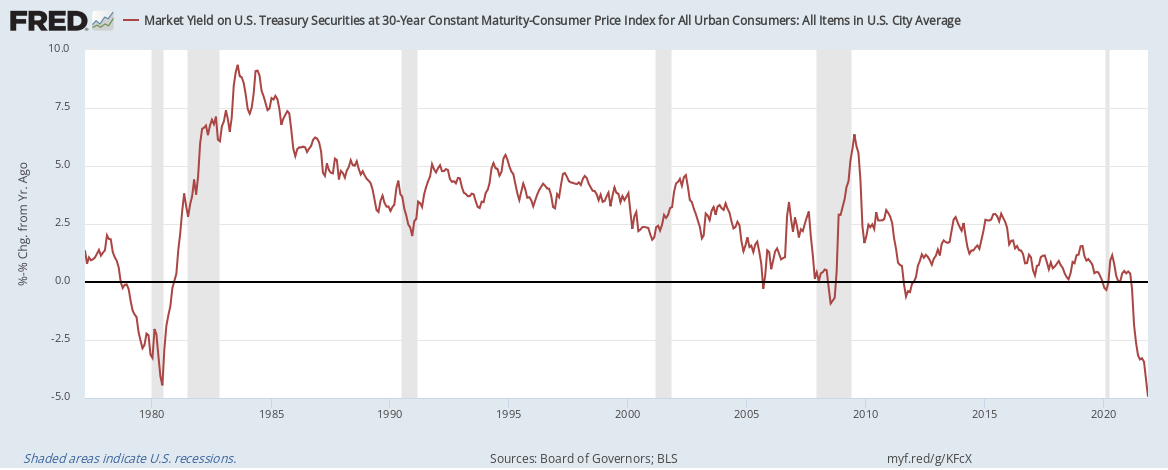
Which was always pretty high before the financial crisis and explains why financial advice books recommend to buy them. Now short maturity hits the floor; 30-Y is still ok-ish.
Negatve nominal rates is a rather new thing
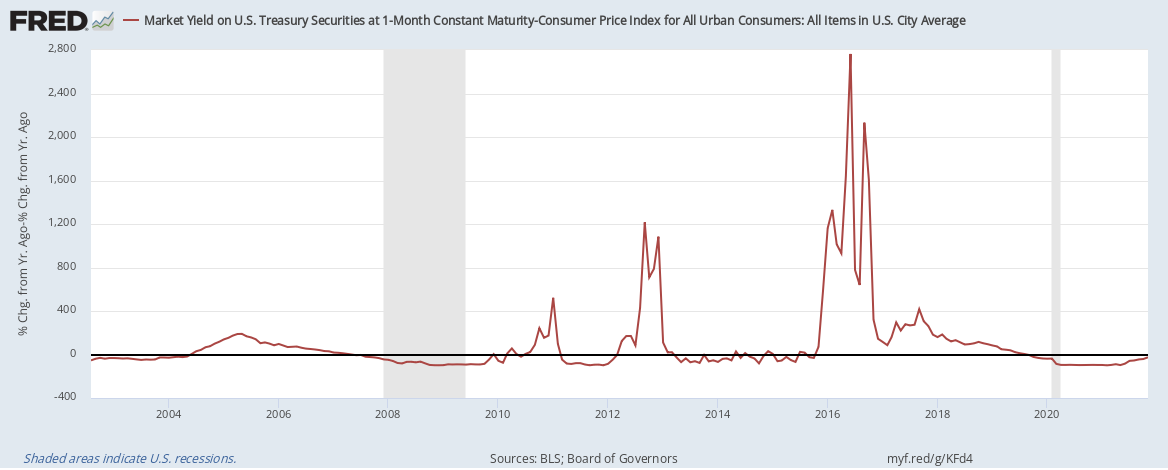
It is however more interesting to look at this but adjusted by the % change of the Consumer Price Index, because you should Always compare yields to inflation.
- 1Mo US Treasuries:
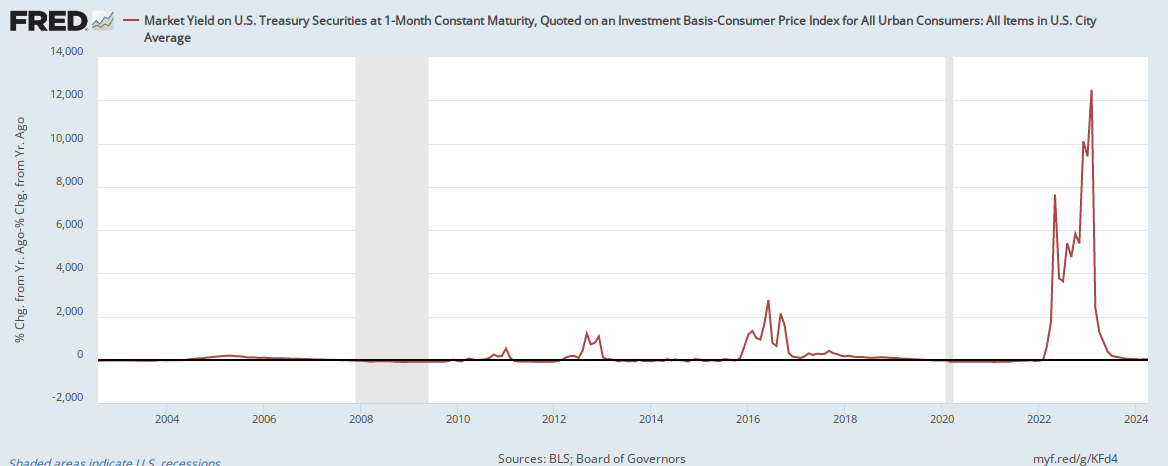
This looks messed up though
The same thing is happening to corporate bonds:
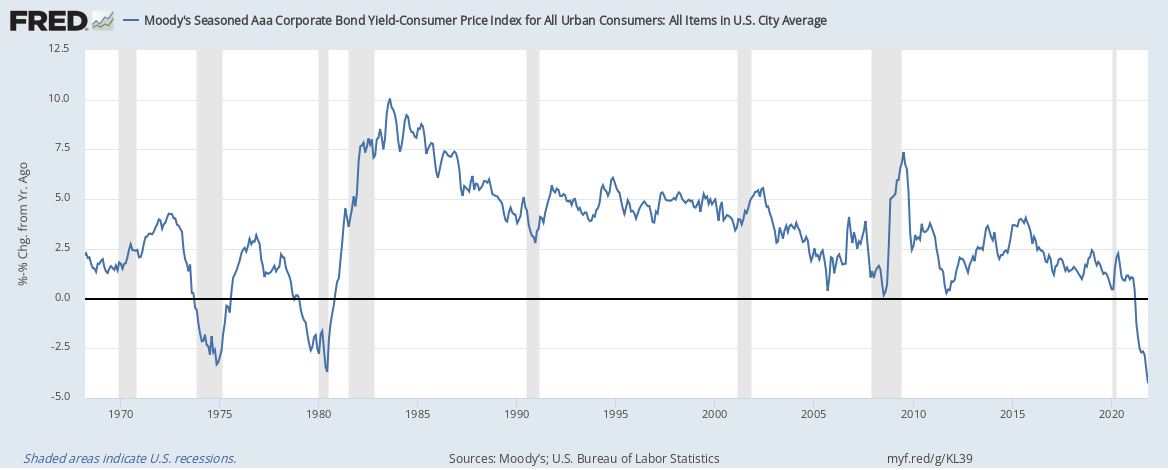
It is clear that the same thing is happening to corporate bonds which could be explained by Quantitative Easing.
TODO Is it what we want to chart? #
Looks like it might be change since last year (which would explain the 1200% increases)